By John Benjamin, Last edited 05/16/2024
Following up on my previous post on interest rates, I’m diving deeper into the world of interest rates. This post will focus on four key rates: credit card interest rates, mortgage rates, auto loan rates, and the influential Fed Funds Rate. By examining trends, relationships, and patterns in each, I aim to paint the picture of the historical interest rate landscape and its potential implications for borrowers.
The Data:
The data used in this analysis starts with the first quarter of 1995 and run through the third quarter of 2023. The data comes from the Federal Reserve Bank of St. Louis website (FRED). I wanted to get a long-term view so we could see any long-term trends and/or patterns present. Concerning frequency, I used quarterly data because I wanted to minimize the daily data noise and still show some of the rate fluctuations that would get missed with yearly data.
Interest Rate Review
Credit card interest rates
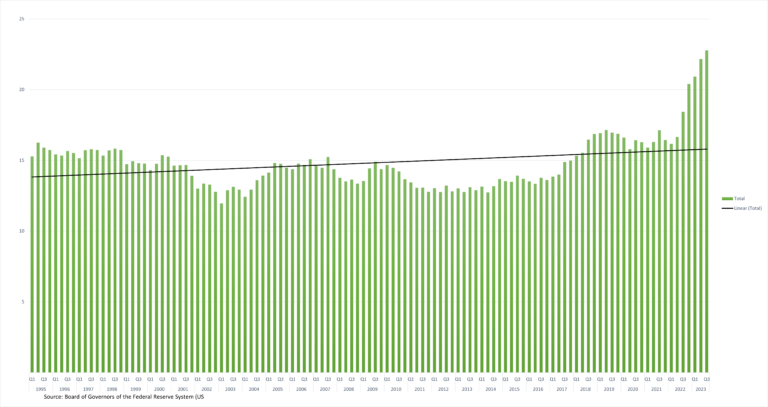
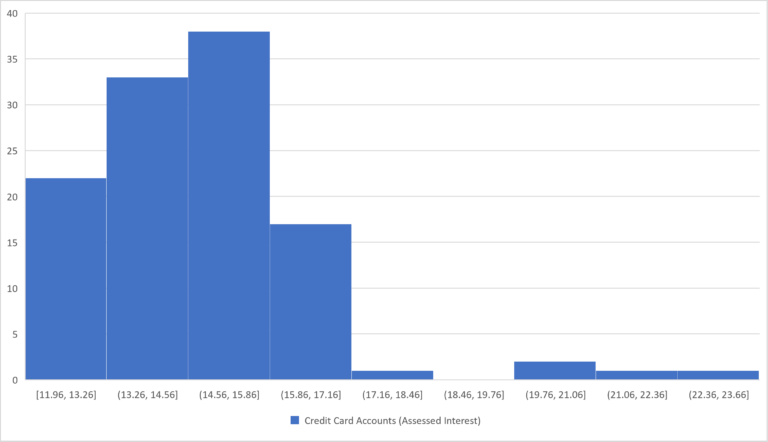
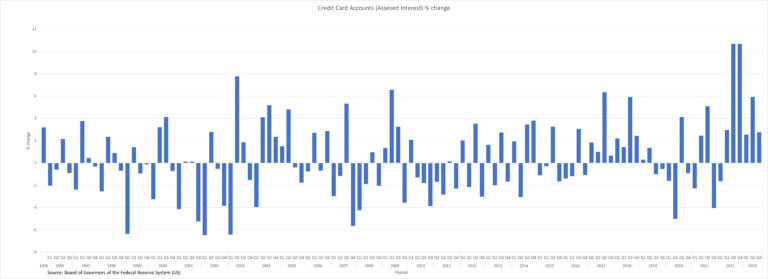
Generally, interest rates are trending upward across the dataset, peaking quarterly at 22.77% in the third quarter of 2023 and hitting a low of 11.96% in the first quarter of 2003. Noteworthy is the substantial rise in Credit Card rates observed in 2022 and 2023. The distribution of Credit Card interest rates reveals that most quarters exhibit rates between 14 and 14.5 percent, with a median rate of 14.65 percent for the period. Image #3 illustrates the percentage change in quarterly credit card interest rates, showcasing significant fluctuations with a range of 17.1% (Min: -6.47, Max: 10.69). An interesting observation lies in the statistical measures; the median is negative (-0.135), while the mean is positive (0.402), presenting an unusual pattern.
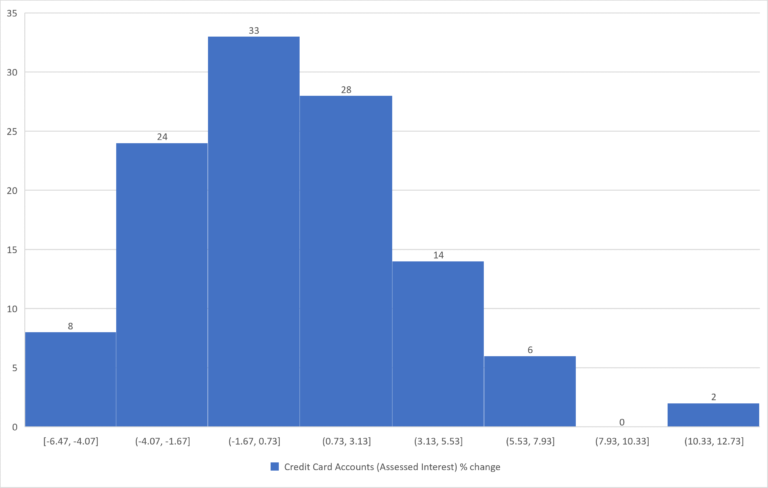
Notably, the largest changes in quarterly credit card rates occurred in consecutive periods Q3 (10.69) and Q4 (10.68) of 2022. Analyzing the distribution of credit card account rate percentage changes, we find that 28.70% of the time, the fluctuation ranged from -1.67% to 0.73%, closely followed by 24.35% in the 0.73 to 3.13% range. Since the second quarter of 1995, more than half of the time, quarterly changes in credit card interest rates have fallen within the range of -1.67% to 3.13%, indicating that large fluctuations such as those witnessed in the third and fourth quarters of 2022 are infrequent. Moreover, over 54% of the time, quarterly changes in interest rates fell between -6.47% and 0.73%, suggesting a significant proportion of quarterly changes were downward.
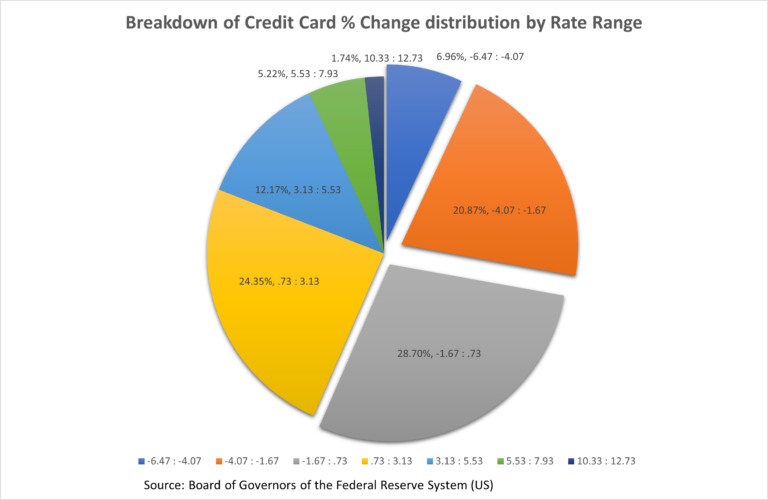
While interest rates have shown an overall upward trajectory, the data underscores the rarity of extreme fluctuations and highlights a notable tendency for downward shifts in credit card rates and although interest rates have generally increased over time, the data shows that significant fluctuations are unusual. In recent times, credit card rates have been steadily declining.
30yr Fixed Mortgage Rates
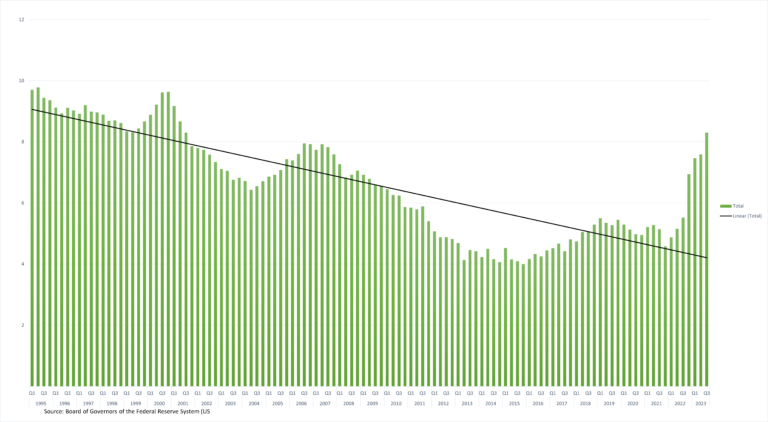
Generally declining throughout the dataset, with a high of 8.79% in the first quarter of 1995 and a low of 2.76% in the fourth quarter of 2020. Some seasonality appears in the dataset with higher rates in the first half and lower rates in the second half. The mean rate for the period is 5.49%, with a median of 5.71%. Examining the distribution of interest rates over the period, we find that 23% of the time, quarterly rates were between 3.76% and 4.76%, closely followed by the range of 5.76% to 6.76% at 22% of the time.
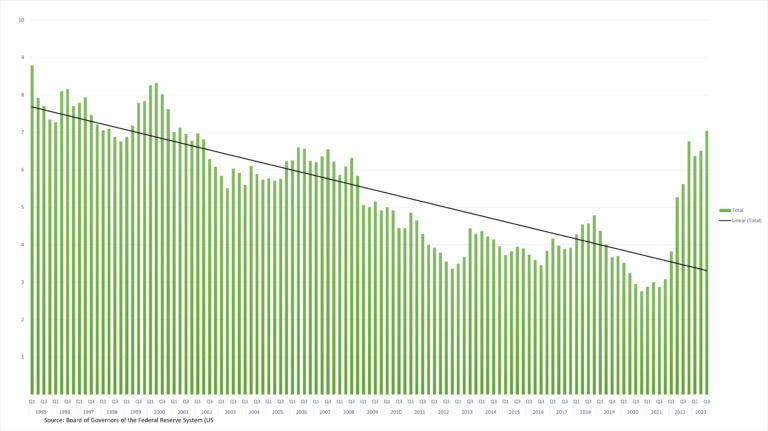
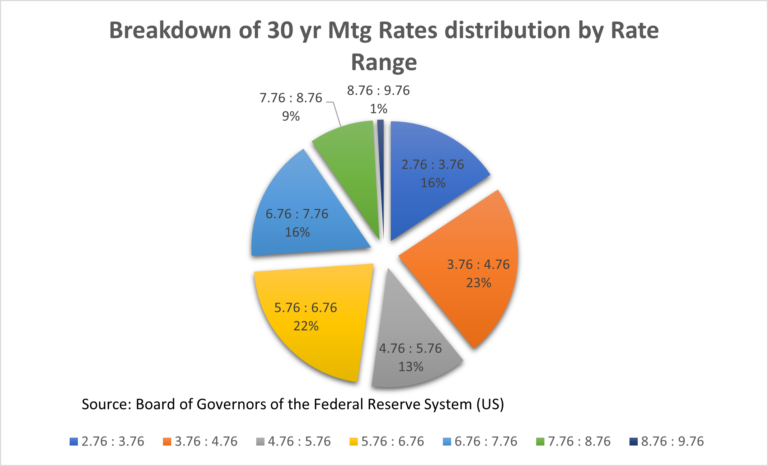
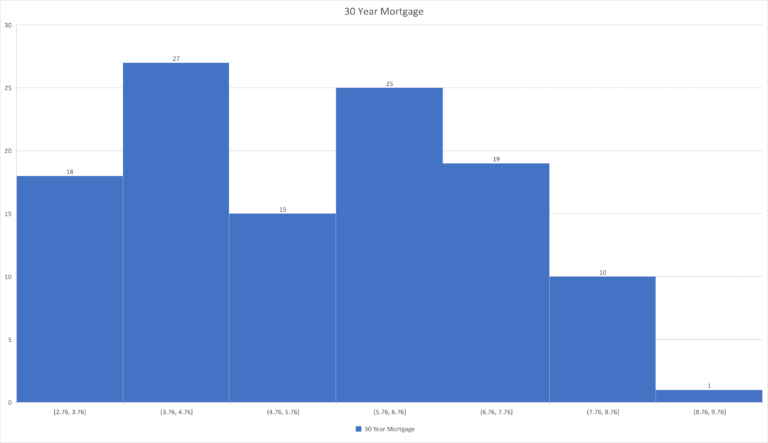
A notable observation is that the fourth quarter consistently exhibits the lowest average rate, standing at 5.401%, which is consistently lower than other quarters in the dataset.
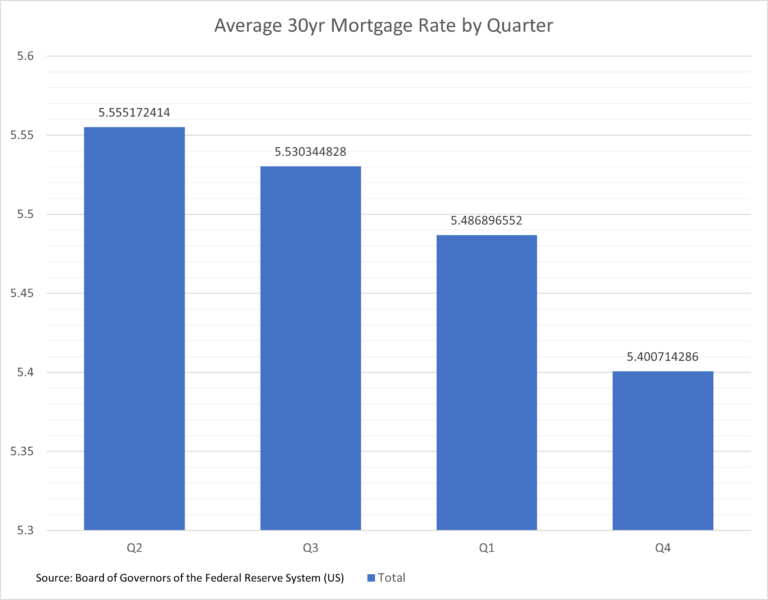
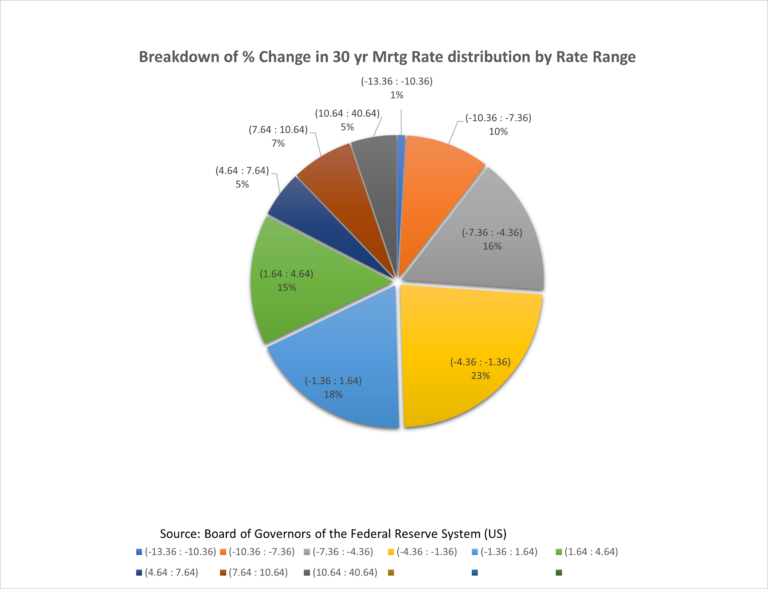
Analyzing the percent change in rates, a similar pattern emerges to credit card interest rates, with the largest change occurring in consecutive periods, the first and second quarters of 2022. The most significant rise observed in rates overall was 37% in the second quarter of 2022, while the largest decline was -13.3% in the first quarter of 2009.
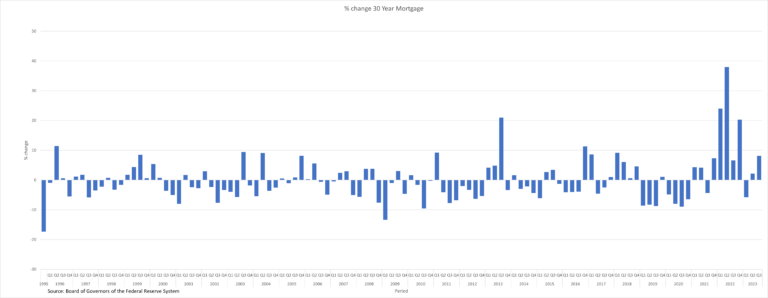
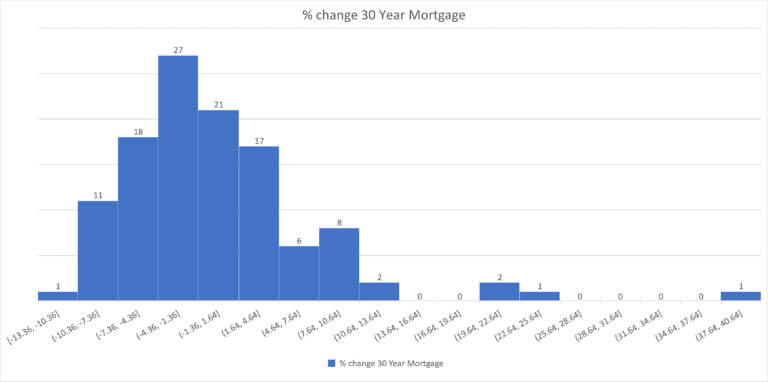
The distribution of percent change in interest rates reveals that more than half of the time, the quarterly change falls between -4.36% and 1.64%. Within this range, the mean is at 0.046% and the median is at -1.26%. Throughout the dataset, 30-year rates demonstrate a consistent decline for most quarters, with any upticks being part of the overall downtrend.
48-month auto loan rate
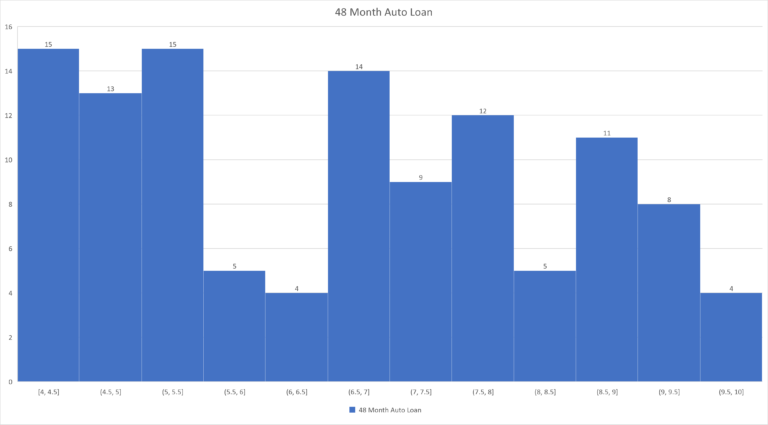
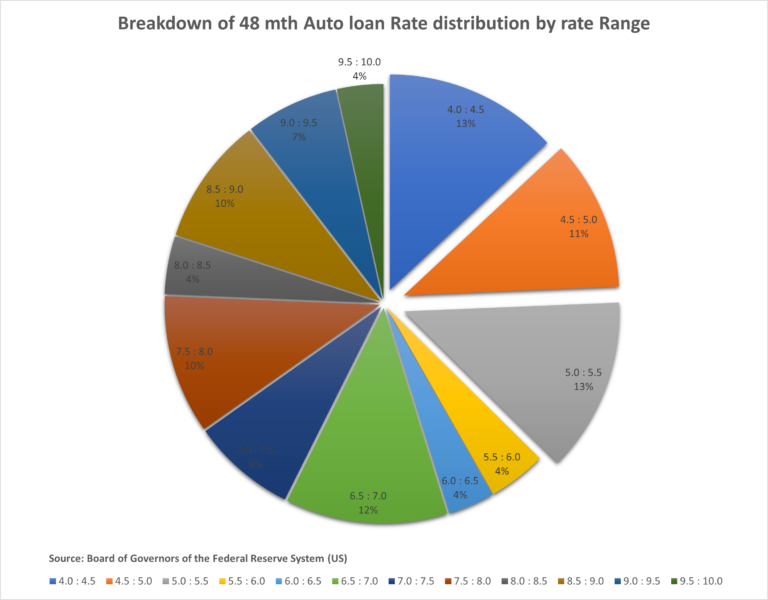
The 48-month auto loan rate demonstrates a relatively stable downtrend compared to other rates in this study, fluctuating between a high of 9.78% and a low of 4%. The peak of 9.78% was recorded in the second quarter of 1995, while the trough occurred in the fourth quarter of 2015. The mean rate stands at 6.63%, with a median rate of 6.76%. Examining the distribution of rates, we find that 37% of the time rates were between 4.0% and 5.5%, making it the most frequently occurring range.
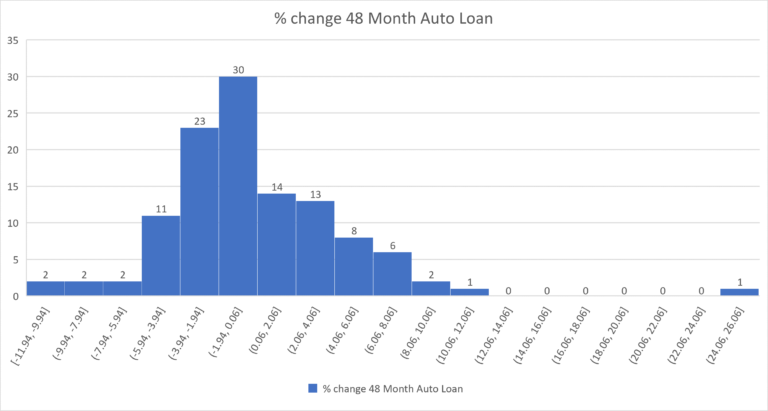
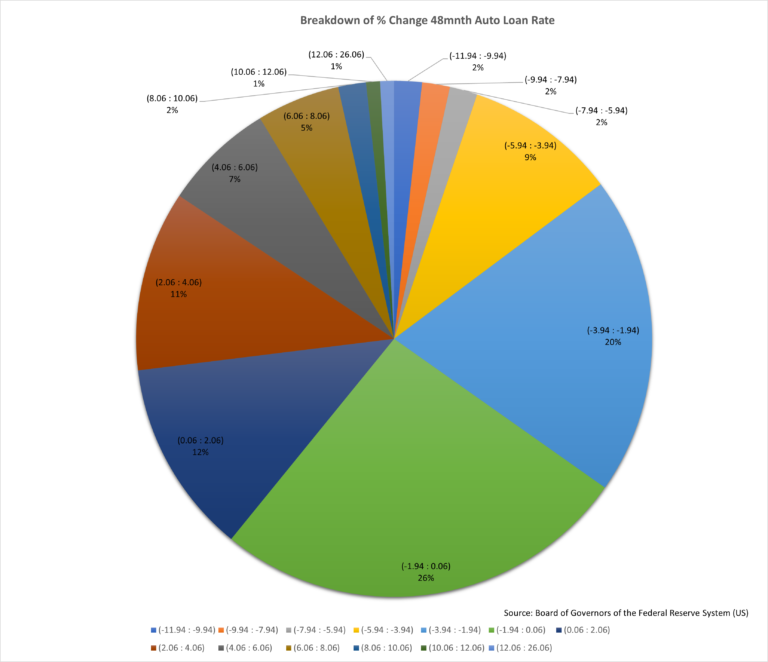
Reviewing the percent change in 48-month auto loan interest rates, we note that only 4 quarters in the entire period saw quarterly percent changes exceeding 10%, either positively or negatively. The largest change occurred in the fourth quarter of 2022, with an increase of 25.72%, marking the most significant shift in rates either upward or downward. The largest reduction in rates happened in the second quarter of 2013, with a decrease of -11.94%.

For the majority of the period under review, the percent change remained within 5%, either positively or negatively. The distribution of 48-month auto loan rate percent changes corroborates this, with 56% of the data falling within the range of -3.49% and 0.06%. Similar to other datasets in this article, we observe a downward trend until the first quarter of 2022.
Fed Funds Rate
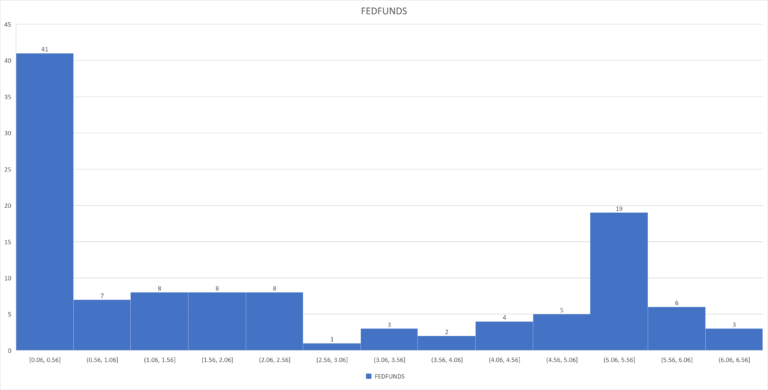
The chart illustrates a robust downtrend attributed to the prolonged period of fed fund rates below 1%. Among the 115 observations, 45 or 39% were below 1.0% in the dataset. Analyzing some statistics from the dataset, we observe that the mean stands at 2.38%, while the median is 1.73%. The dataset’s maximum fed funds rate is 6.52%, and the minimum is 0.06%.

In the distribution of Fed Funds Rates, the majority of rates are skewed towards the left side of the histogram, supporting the earlier assertion of an extended period of low Fed funds rates. Another notable range where a significant number of occurrences were observed compared to other ranges was the 5.06% to 5.56% range.
Examining the magnitude of changes in the Fed Funds rate, we note significant fluctuations, exceeding 100% in both directions, either upward or downward. However, for the most part, the percent change remained under 100% in either direction. Specifically, the mean percent change was 8.47%, and the median percent change was 0.19%, both notably lower than the largest percent change observed in the data.
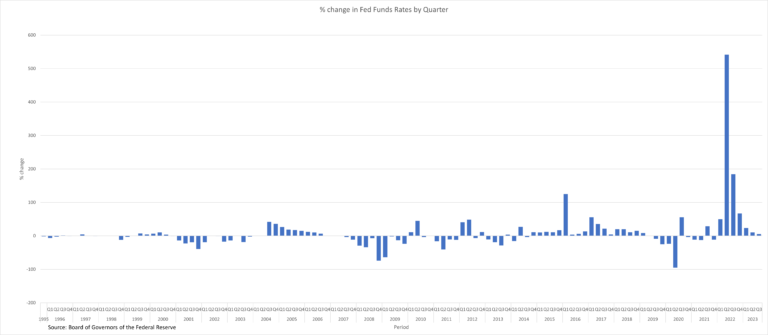
The second quarter of 2022 recorded the largest percent change, with an increase of 541.66%, marking the highest percent change observed and to the upside. Conversely, the second quarter of 2020 saw the largest percentage change to the downside, at 95.23%, also representing the minimum percent change observed
Final Thoughts
The above analysis offers a bit of perspective for anyone seeking interest rate information. The insights from this analysis can be used to assist consumers in the creation of a sound financial plan before agreeing to years of interest payments. I think we all can agree that by understanding the historical trends and fluctuations in interest rates, consumers can confidently navigate the dynamic interest rate environment. Remember, staying informed is key to making sound financial choices. So how can you use this information for your benefit? Good Question. Below are some examples.
Example of how studying Interest rate trends can benefit you.
- By studying how interest rates have changed over time, you can gain insights into potential patterns and cycles. This knowledge can help you anticipate future interest rate movements.
- You can identify favorable times to make major purchases (e.g., homes, cars) when rates are lower, thereby minimizing the interest costs associated with big purchases.
- You can use interest rate projections to anticipate changes in the costs of variable-rate loans or lines of credit, allowing you to adjust your budgets and cash flow plans.
- Consumers with existing debts, such as mortgages, student loans, or credit card balances, can use interest rate trend information to explore opportunities for refinancing or consolidating their debts at lower interest rates, potentially saving significant amounts over time.
