Introduction
Technical analysis is a widely used feature of investing that involves evaluating securities by examining statistics generated by market activity, such as historical prices and trading volumes. Technical analysis relies on various indicators to forecast future price movements, recognize trend direction, and identify trading opportunities. Investors utilize technical analysis to make informed decisions based on historical data rather than focusing solely on fundamental factors.
Indicators play a vital role in technical analysis, providing insights into market trends and potential reversals. Commonly used indicators include moving averages, the Relative Strength Index (RSI), Bollinger Bands, MACD, and Average True Range (ATR), each with unique functions in assessing market conditions. By understanding these tools, investors can navigate the intricacies of the financial markets more successfully.
Before diving into the specifics of technical indicators, it is helpful to grasp the basic concepts of averages and moving averages, which are foundational to many of these analytical tools.
Understanding Averages and Moving Averages
An average is a simple tool that represents the central value of a set of numbers. Imagine you have five daily closing prices of a stock: $10, $12, $11, $13, and $12. In this case, the average is the sum of these prices divided by the number of prices: (10 + 12 + 11 + 13 + 12) ÷ 5. Averages help investors get a quick sense of the general trend without being overwhelmed by daily fluctuations.
Moving averages take this concept a step further by smoothing out price data to create a clearer picture of the trend over time. Instead of calculating an average from a fixed set of numbers, a moving average updates continuously as new data comes in. Think of it as a rolling average that adapts to the most recent data. For example, a 10-day moving average adds up the closing prices of the last 10 days and then divides by 10, updating this calculation each day by dropping the oldest price and adding the newest one. This helps investors see the forest for the trees, identifying trends and potential support and resistance levels in a sea of market noise.
The Simple Moving Average (SMA) calculates the average of a selected range of prices, usually closing prices, by the number of periods in that range. For instance, a 10-day SMA adds up the closing prices of the past 10 days and divides by 10. The Exponential Moving Average (EMA), on the other hand, is a type of moving average that places greater weight and significance on the most recent data points. The EMA reacts more quickly to recent price changes than the SMA. The key difference between the SMA and the EMA is that the SMA assigns equal weight to all observations in the period, whereas the EMA applies more weight to recent prices, thus capturing recent price changes more swiftly.
Let's go through a simple calculation of the Exponential Moving Average (EMA)
For example, assume we have 10 days of closing prices for a stock as follows:
Day 1: $10
Day 2: $12
Day 3: $11
Day 4: $13
Day 5: $12
Day 6: $14
Day 7: $13
Day 8: $15
Day 9: $14
Day 10: $16
**Step 1: Calculate the SMA for the first 10 days:**
SMA = (10 + 12 + 11 + 13 + 12 + 14 + 13 + 15 + 14 + 16) / 10 = 130 / 10 = $13.
**Step 2: Calculate the multiplier:**
Multiplier = 2 / (N + 1) = 2 / (10 + 1) = 2 / 11 ≈ 0.1818.
**Step 3: Calculate the EMA for Day 11 and onward:**
EMA (current) = (Closing price – EMA (previous)) * Multiplier + EMA (previous).
Let’s assume the closing price on Day 11 is $17, the EMA for Day 11 would be:
EMA (Day 11) = (17 – 13) * 0.1818 + 13 = 4 * 0.1818 + 13 ≈ 0.7272 + 13 = $13.73
5 Essential Technical Indicators
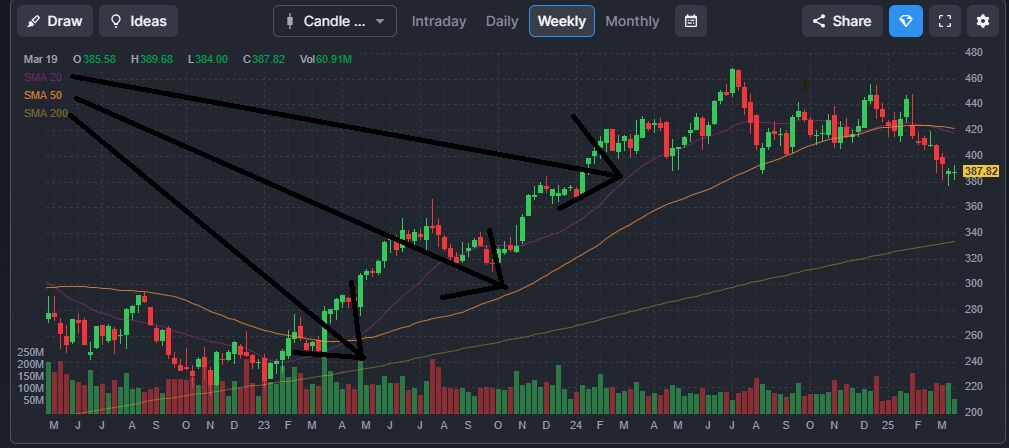
1. Moving Averages (50 and 200-day)
The interaction between these two moving averages, particularly the Golden Cross (50-day crossing above 200-day) and Death Cross (50-day crossing below 200-day), signals major trend changes that often influence institutional portfolio decisions. Professional traders value these indicators because they effectively filter out market noise while highlighting significant trend changes. The 200-day moving average is widely watched as a benchmark for long-term trend direction and often becomes a self-fulfilling prophecy due to its widespread use.
2. Moving Average Convergence Divergence (MACD)
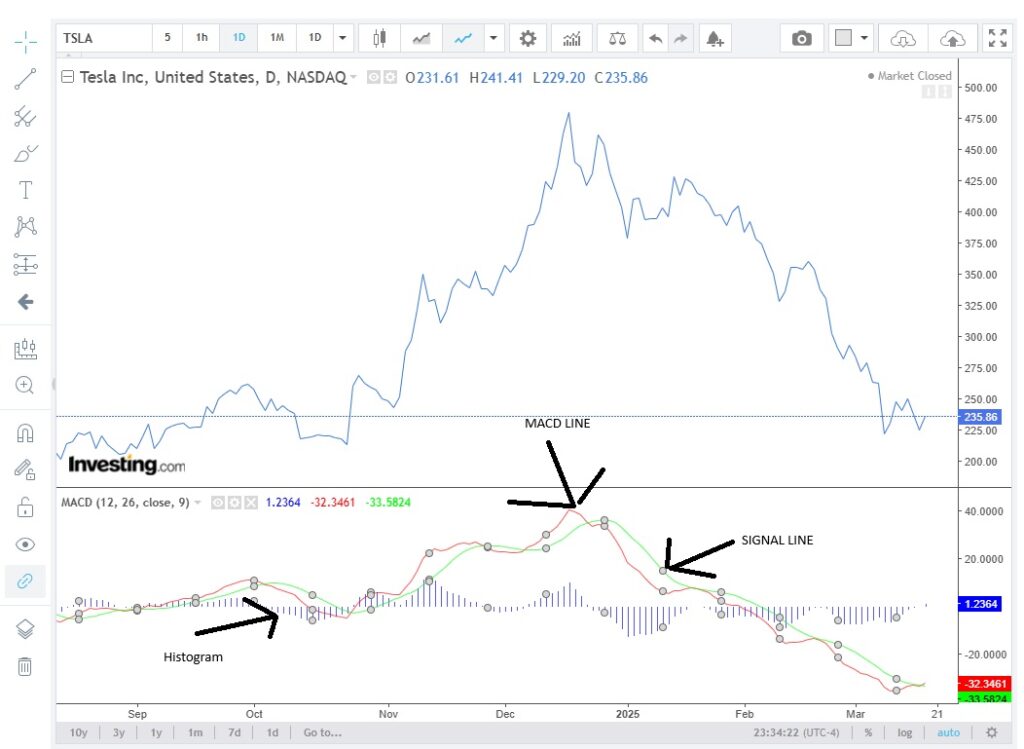
The MACD is a momentum indicator that reveals both trend direction and strength by comparing two moving averages. It’s calculated by subtracting the 26-day Exponential Moving Average (EMA) from the 12-day EMA, with a 9-day EMA as the signal line. Professional traders like MACD because it combines trend-following and momentum elements in a single indicator. The histogram represents the distance between the MACD and signal line, offering insight into momentum strength. What makes MACD especially powerful is its ability to identify divergence situations where price makes new highs or lows but the MACD doesn’t confirm, often signaling potential reversals. Professional traders often use this for market timing, particularly when combined with volume analysis.
-26DAY EMA – 12DAY EMA=MACD LINE
-9DAY EMA = SIGNAL LINE
3. Relative Strength Index (RSI)
The RSI is a momentum oscillator that measures the speed and magnitude of directional price movements. Operating on a scale from 0 to 100, it compares the magnitude of recent gains to recent losses to determine overbought or oversold conditions. While traditional levels of 70 and 30 mark overbought and oversold conditions respectively, professional traders often adjust these levels based on market conditions and the specific asset being traded. What makes RSI valuable is its ability to show divergences between price and momentum, often providing early warnings of potential trend reversals.
How is RSI Calculated?
RSI is calculated using a 14-day average of price changes.
Step 1: Calculate the Average Gains and Losses
- Look at the price changes over the last 14 days.
- Separate them into gains (days when the price went up) and losses (days when the price went down).
- Find the average gain and the average loss over these 14 days.
Step 2: Calculate the Relative Strength (RS)
RS (Relative Strength) is simply:
RS=Average Gain/Average Loss
This compares the average amount of gains to the average amount of losses.
Step 3: Calculate the RSI
Now, we turn RS into a number between 0 and 100 using this formula:
RSI=100−(100/1+RS)
RSI=100−(1+RS/100)
Example Calculation
Let’s say over the last 14 days:
- The average gain was 1.5%.
- The average loss was 0.5%.
First, calculate RS:
RS=0.5/1.5=3
Now, calculate RSI:
RSI=100−(100/1+3)
RSI=100−(4/100)
RSI=100−25=75
Since 75 is above 70, the stock is considered overbought, meaning it may be due for a price drop.
*How Do Traders Use RSI*
If RSI is above 70, traders may sell to lock in profits.
If RSI is below 30, traders may buy expecting a rebound.
If RSI is around 50, there is no strong trend, so traders may wait.
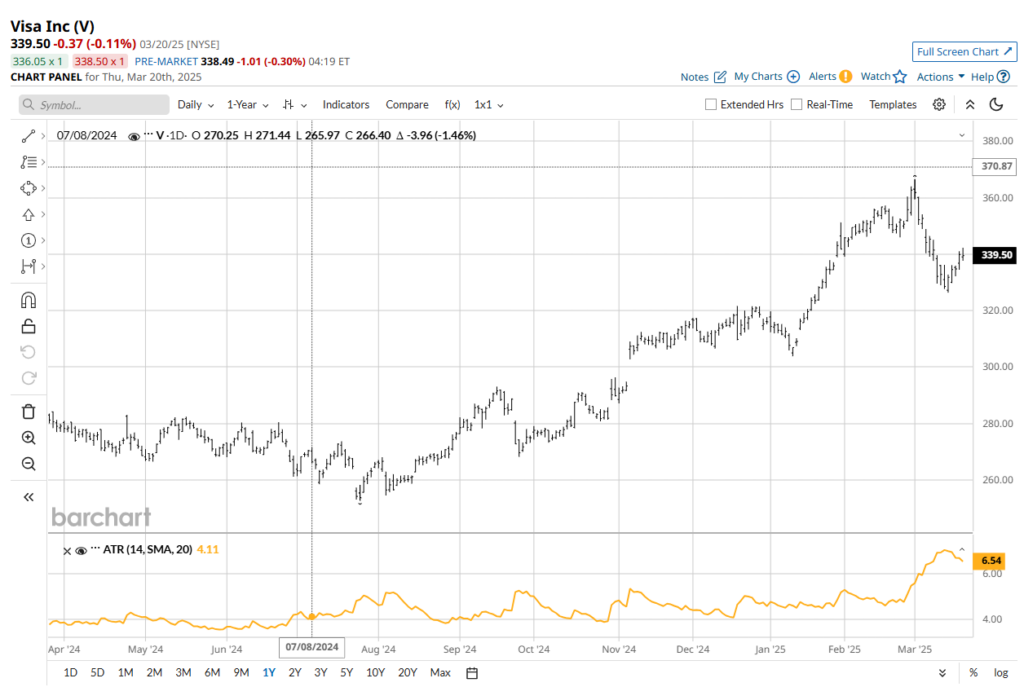
4. Average True Range (ATR)
The Average True Range (ATR) is a tool that helps us understand how much a price tends to move up and down, similar to measuring the waves in an ocean. Think of it like a thermometer for market movement – instead of measuring temperature, it measures how much prices swing both up and down over time. When the ATR reading is high, it tells us that prices are making big moves, like waves during a storm. When it’s low, prices are calmer, like gentle ripples on a lake. This information helps investors make better decisions about when to buy or sell, and how to protect their investments from unexpected price swings.
To find the True Range (TR) for each day, calculate the following
- Current high minus current low
- Current high minus previous close
- Current low minus previous close
- Take the largest of the above calculations for each day in the set. Those will be the TR (True Range)
- Take the average of these TR values over a set number of days (commonly 14 days).
Example Calculation (Using 3 Days for Simplicity):
- Day 1: High = 105, Low = 100, Previous Close = 102
- TR = Max(105-100, 105-102, 102-100) = 5
- Day 2: High = 107, Low = 101, Previous Close = 105
- TR = Max(107-101, 107-105, 105-101) = 6
- Day 3: High = 110, Low = 103, Previous Close = 107
- TR = Max(110-103, 110-107, 107-103) = 7
ATR (3-day) = (5 + 6 + 7) / 3 = 6
This means the stock typically moves 6 points per day, giving traders an idea of its volatility.
5. Bollinger Bands
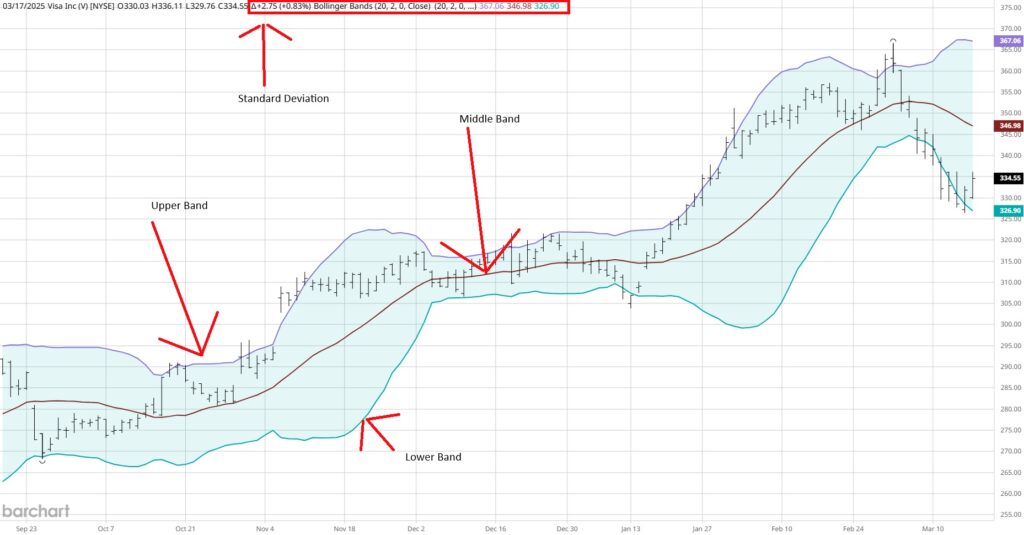
Bollinger Bands are a technical analysis indicator that measures market volatility by creating a channel around the price’s moving average. The indicator consists of three lines: a middle band (a 20-period simple moving average), an upper band (middle band plus two standard deviations), and a lower band (middle band minus two standard deviations). The indicator’s bands naturally widen during volatile periods and narrow during consolidation. Professional traders utilize Bollinger Bands to identify possible price extremes and measure volatility cycles. They often use the width of the bands to gauge potential breakout opportunities and the middle band (20-day SMA) as a mean reversion level for price action. Prices near the upper band may indicate overbought conditions, which is looked at as a sell signal, and prices near the lower band may indicate oversold conditions, which is viewed as a buy signal.
Calculation
Middle Band: Calculate a simple moving average (SMA), typically using 20 periods.
- SMA = (Sum of closing prices over n periods) ÷ n
Standard Deviation: Calculate the standard deviation of the same data set.
- Standard Deviation = √[(Σ(x – SMA)²) ÷ n]
- Where x represents each closing price in the data set
Upper Band: Add 2 standard deviations to the middle band.
- Upper Band = SMA + (2 × Standard Deviation)
Lower Band: Subtract 2 standard deviations from the middle band.
- Lower Band = SMA – (2 × Standard Deviation)
Conclusion
Technical analysis gives investors valuable tools to navigate the markets more effectively. The five indicators we’ve explored—Moving Averages, MACD, RSI, ATR, and Bollinger Bands—each serve a unique purpose in identifying trends, momentum, overbought/oversold conditions, volatility, and price extremes. While these indicators provide helpful signals, they work best when used together rather than in isolation. Most importantly, making good investment choices requires combining these technical tools with sound risk management practices and aligning your trading decisions with your personal financial goals. By understanding these indicators and using them wisely, you’ll be better equipped to make informed choices that can improve your trading results and help you navigate market uncertainty with greater confidence.
Discover more from
Subscribe to get the latest posts sent to your email.

