BY: JOHN BENJAMIN – UPDATED ON 07/11/2023
This article will examine the returns of 30 different industries’ portfolios during the COVID-19 pandemic. I hope to reveal which specific industries demonstrated resilience and effectiveness during these volatile periods, and which industries did not. Understanding which portfolios performed best can provide valuable insights for risk management strategies, portfolio allocation decisions, and asset pricing models. This information can help investors and analysts navigate uncertain market conditions more effectively. Investors and analysts who want to navigate uncertain market conditions more effectively should read on.
The data used in this study was Fama French 30 industry portfolio returns. The dataset contains the monthly return for each industry portfolio starting in July 1926 and ending in May 2023. The specific period used begins in Jan 2020 and ends in May 2023. The industries under review include food, beer, books, Autos, Hlth, and many others. Due to yearly changes in the makeup of the NYSE, AMEX, and NASDAQ, some portfolios may differ from year to year. Industry destination was based on Compustat SIC codes and whenever Compustat SIC are not available CRSP SIC codes are used per the Fama French websites.
The specific period used in this study corresponds to the early months of the COVID-19 pandemic. The COVID-19 pandemic was declared a pandemic by the WHO on March 11, 2020. In early May 2023, the WHO ended its declaration of COVID-19 being a global health emergency. This means that the WHO no longer considers the outbreak to be a major international threat to public health. For more information on the pandemic, please visit the WHO website: https://www.who.int/emergencies/diseases/novel-coronavirus-2019
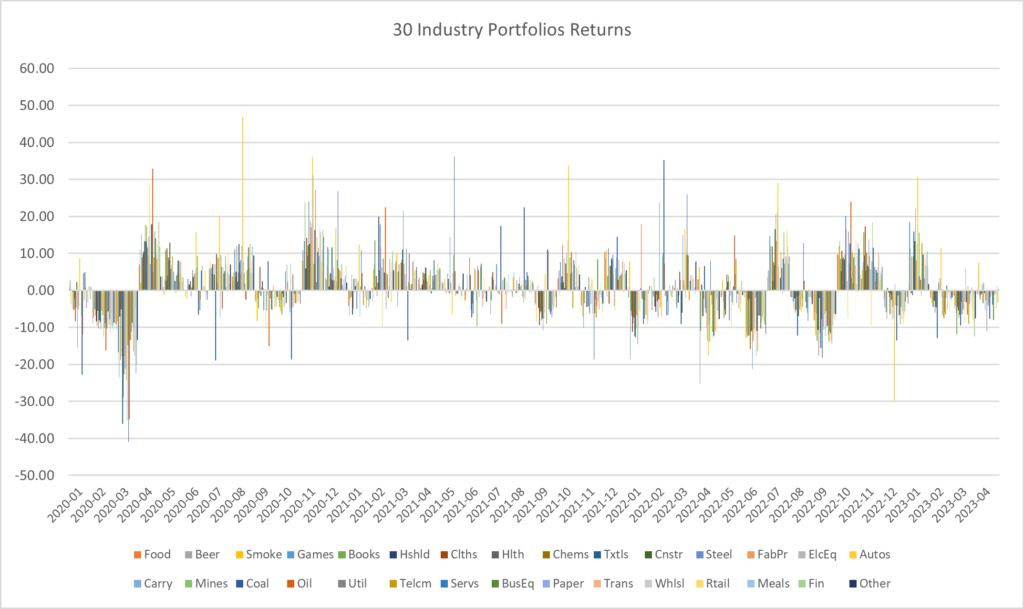
I looked at the mean, variance, standard deviation, median, and range of the data to gain insights into the performance of different industries during the COVID-19 pandemic. I also looked at the total return of $1,000 for each industry.
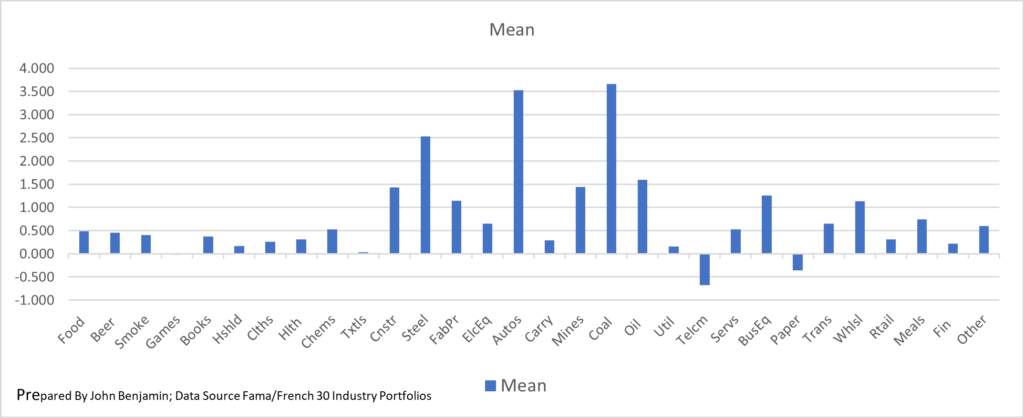
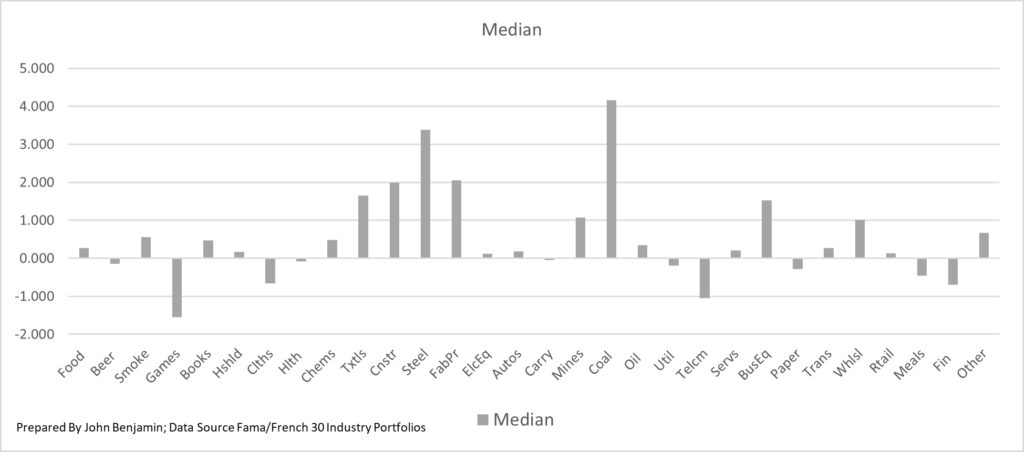
The mean and median are two measures of central tendency that are used to describe the average of a data set. The mean is calculated by adding up all the values in a data set and dividing by the number of values. The median is calculated by arranging the values in order and then finding the middle value. The median is a better measure of central tendency for data sets with outliers because it is less affected by these values.
The coal industry had the highest mean and median return over the period under review. The mean monthly return for coal was 3.6%, while the median monthly return was 4.16%. The telecom industry had the lowest mean monthly return, at -0.679%, and the games industry had the lowest median monthly return, at -1.54%. These results suggest that the coal industry was the most resilient industry during the period under review.
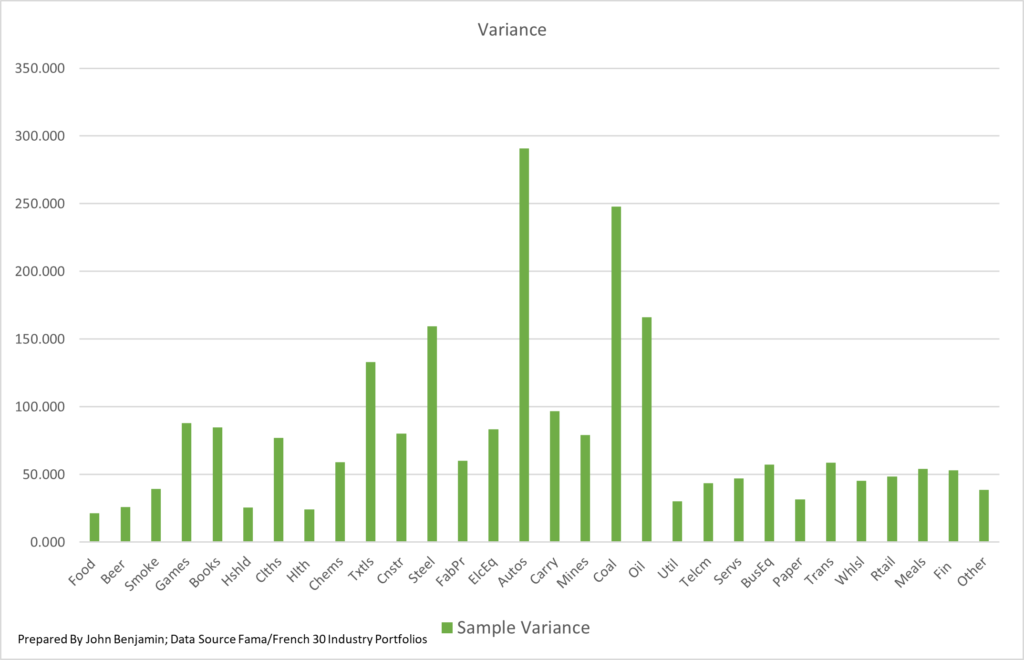
Variance is a measure of how far a set of numbers is spread out from their average value. It is calculated by taking the average of the squared differences between each number and the mean. Variance is often used to measure the risk of an investment. A high variance means the investment is likely to experience large swings, while a low variance means the investment is likely to be more stable. An investment with a higher variance than another investment is likely to have a higher risk, but it may also have the potential for higher returns. Looking at the data, the industry with the lowest Variance is food with a variance of 21.345 while auto had the highest variance at 290.702.
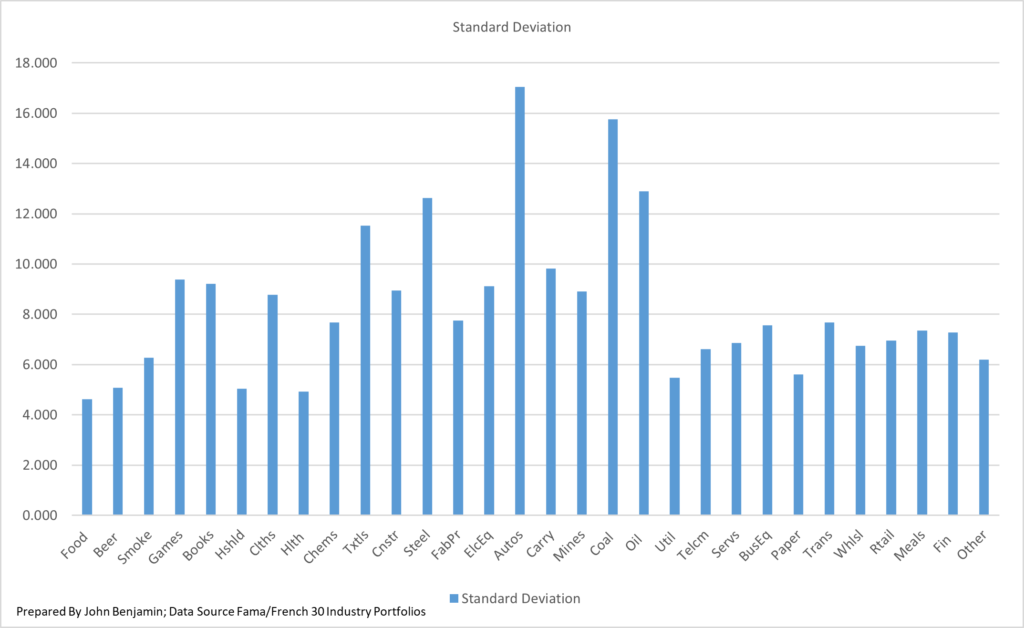
Standard deviation is a measure of how spread out a set of numbers is. It’s calculated by taking the square root of the variance. A high standard deviation means that the investment is likely to experience large swings in price, while a low standard deviation means that the investment is likely to be more stable. The standard deviation can also be used to compare the performance of different investments. An investment with a higher standard deviation than another investment is likely to have a higher risk, but it may also have the potential for higher returns. The Food Industry has the lowest standard with 4.620 while the Auto has the highest standard deviation with 17.050.
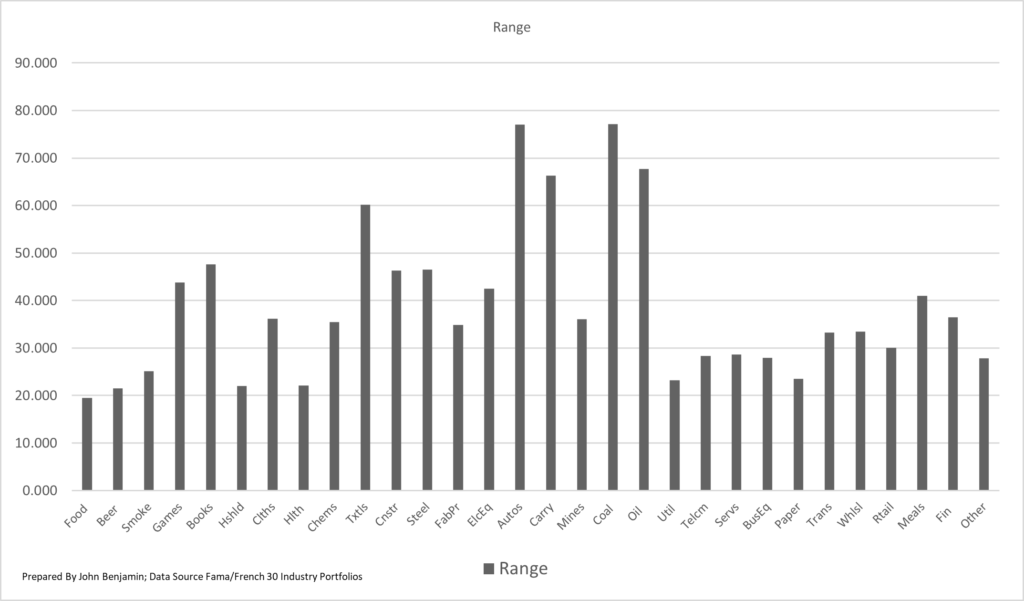
The range is also a good metric to use when comparing investment options. The range is the difference between the highest and lowest values in a data set. It is a measure of how spread out the data is. A large range indicates that the data is spread out over a wide range of values, while a small range indicates that the data is concentrated around a central value. The Coal industry range was the highest at 77.160 just edging out the Auto industry at 77.010. The Food industry was the lowest with 19.470.
Correlation measures the strength of the relationship between two variables. A correlation of 1 means that the two variables are perfectly correlated. This means that when one variable goes up, the other variable always goes up. A correlation of -1 means that the two variables are perfectly negatively correlated. This means that when one variable goes up, the other variable always goes down. A correlation of 0 means that the two variables are not correlated at all.
Investors can use correlation to determine which investments to invest in based on the correlation value. For example, if two investments are highly correlated, investors may only want to select one of them and look for another investment that has a lower or negative correlation. This would limit the loss on a down day for the investment because the other investment will be moving in the opposite direction.
Looking at the data, we see that the strongest correlation is between Wholesale & Chemicals and the weakest correlation is between Autos and Smoke.

investor looking for a place to preserve capital & get a return during turbulent times, selecting a specific industry could reduce stock-specific exposure and time researching companies. For investors looking to invest in industry-specific investments ETFs and Mutual Funds are a great option. However, when selecting EFT or Mutual Funds investments investors should consider fees and taxes also as fees and taxes can eat into your returns.
After carefully analyzing the data, I identified five industries that demonstrated noteworthy performance: Auto, Coal, Food, Games, and Telecom. Of the five industries that stood out coal and autos delivered the best returns over the period. Meanwhile, the food industry was the most stable. Autos had three of the highest return months at 47%, 36%, & 33%. Cole had the largest down month at -41 percent. The five Industries with the highest total return are 1. Coal 159% 2. Autos 139% 3. Steel 100% 4. Mines 52% 5. Construction 49%. The five Industries with the lowest total return are 1. Telecom -31% 2. Textiles -23% 3. Paper -18% 4. Games -16% 5. Carry -8%.
If you invested $1,000 in the top total returning Industry and took all your money out at the end of the period, you would have $2,956.93. Consequently, if you invested $1,000 in the lowest return and took all your money out at the end of the period, you would have $698.73.
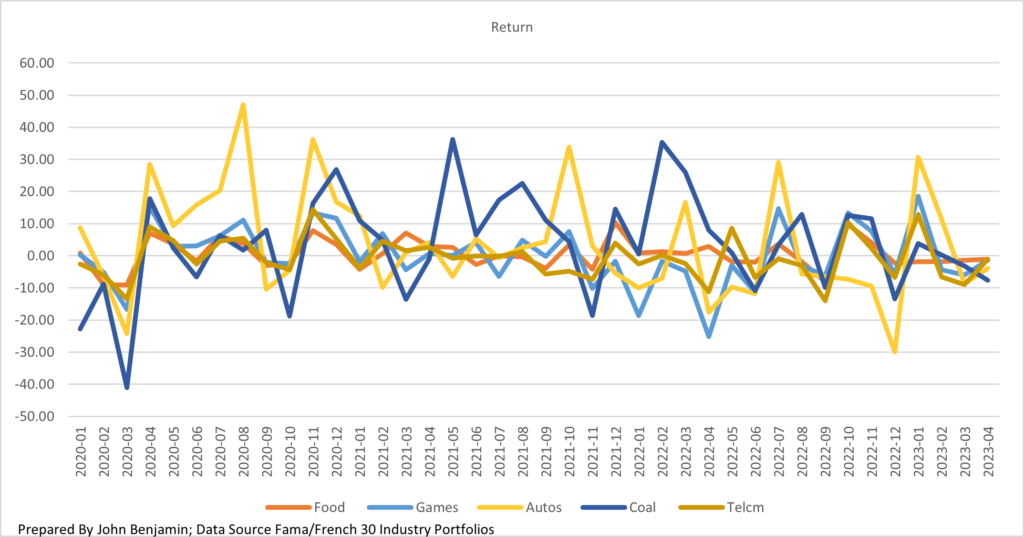
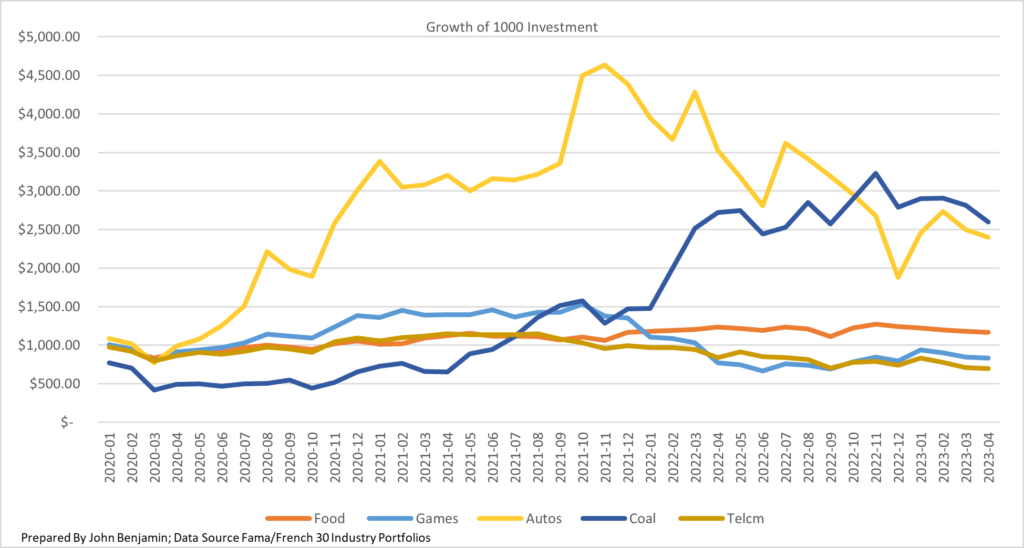
Reflecting on the conditions people endured during the pandemic, a period of isolation and uncertainty. The return data supports an assertation that people were isolated in their homes preparing for uncertain times. Stocking up on food when able and keeping a safe distance from other people. It’s also clear some needs are constant while others fluctuate with current economic conditions.
Let’s take a closer look at each of the five notable industries. Coal is a major source of power and electricity in many countries, and as power demand increases or decreases, so does the use of coal. Moving on to the Auto Industry, heightened isolation due to increased risk of infection and lack of public transportation for the same reason led to a greater demand for cars, trucks, and SUVs. However, it is important to note the lockdown measures implemented during the period under review limited travel, leading to instances where personal transportation was unnecessary, but at other times, it became essential. The Games industry’s returns were unexpected given the make of the industry’s portfolio. The portfolio consists of companies in the following spaces fishing, Toys, Motion Picture Production, amusement and recreation, professional sports, and misc entertainment. Companies in these businesses had various periods and levels of opening and shutting down. I think the inconsistency had a major role in their profits and the Games industry returns overall.
Shifting to telecom, we were all online for everything from work and entertainment to education. Not to mention social media which was many people’s only way to connect with coworkers, friends, and family. So, it’s surprising the telcom industry did not have positive returns during the period under review. I do think some of the same issues that plagued the Games industry also affected the telcom industry. Inconsistent operations status for many companies while paying employees and not receiving payment for services could help explain the bad return.
As an investor looking to invest during a similar period. I would for sure use the pandemic period data to assist me when making investment decisions. The insights from this data could mean the difference between getting a stable return, loss, or a volatile return. At the least, investors can better understand how the pandemic affected different industries and make more informed investment decisions while navigating similar conditions

Itís hard to come by educated people for this topic, but you seem like you know what youíre talking about! Thanks